80/50 Investment Strategy:
When was the last time you had the odds inyour favor while being risk-neutral? MainLine introduced its value driven 80/50 intermediate investment strategy in 2013 and, after the crazy last ten years, decided to see how it performed. Let’s just say it remains an approved SWAN investment strategy and performed better than anticipated.
Munis showed a slight outperformance versus taxables for the month, but this was due to the muni composite index having a slightly shorter duration as yields increased roughly the same on average across the curve. The market felt a little heavy all month, but the increase in yields and strong bullish technicals have munis looking good for the next 60 to 90 days.

Muni Market Review
Munis slightly outperformed in May versus taxables, as the Bloomberg composite index was down -.9% versus US Government index – 1.09%. Munis felt heavy all month as the liquidation of the SVB $7 billion portfolio continued and a slight increase in issuance had investors on the defense. Highlights as follows:
- Muni yields were higher from 42 to 20 bps as the curve flattened. Taxable yields were higher from 30 to 20 bps as it also flattened.
- Muni value looks good all along the curve, with 15 years on out showing the best value.
- Supply remains down, is increasing slightly due to seasonals but is still not where many thought it would be at this point in 2023. Year to date versus 2022 issuance is down 24% and down 3% from the five-year average.
- SVB liquidation appears to be 30% to 40% complete and continues to be made up of low coupon, long duration bonds. Recent activity shows bonds are trading at 4.40%- 4.60% yield, but after adjusting for the de minimis tax this is a tax-free yield of 3.80%- 4.00%.
MainLine feels munis are set up nicely for good performance over the next 60 to 90 days, as season technicals will finally take over and yields are higher after the May selloff.
Market News & Credit Update:
- In reviewing muni market data, the prediction in 2020 that the 4% coupon is the new 5% was an ugly head fake. Historically, 5% or higher coupons average from 40% to 60% of issuance but from 2020 to 2021 only 15% to 20% of new issuances had coupons 5% or greater with 4% or lower making up the other 80% to 85%. Year-to-date 2023, 5% coupons or greater are back at 60%. I guess the 4% coupon is no longer the next 5%. Muni investors learned the value of the additional premium coverage when it comes to extension risk and the cost of the call option after the ugly rise in rates over the last year.
- Muni credit, for the most part, is immune from the debt ceiling debacle, as shown with Prerefunded bonds (bonds backed by the US Government) trading cheaper than top tier rated muni bonds. Yet, a prolonged payment prioritization according to Moody’s could cause credit downgrades as follows:
- The hospital sector if Medicaid/Medicare payments are disrupted.
- Housing sector – Military and Section 8 projects as they rely on Federal appropriations. State HFAs are less exposed as they rely on reserves
- Transportation sector such as GARVEES (backed by US highway trust funds) depending on financing details, and issuer/underlying projects.
- Federal lease deals as they also rely on appropriations.
- Liquidation of $7 billion munis owned by SVB has begun, and it appears to be a bit of a burden to the muni market. The early rounds have been from $55 to $70 million in par, but the bid lists now contain the unattractive bonds that dealers are struggling to inventory at the moment.
80/50 SWAN Investment Strategy – Revisited
Introduction:

If I told you there was a game where you could get 80% of the potential payout, while taking only 50% of the risk, would you play that game? Or what if a team had an 80% chance of winning a game, but the bet was for even odds; would you bet on that team? If so, then let MainLine reintroduce you to the 80/50 SWAN investment strategy. This is an updated investment strategy MainLine introduced in September 2013. We felt like this would be a good time to revisit the strategy and see how it has done over the last ten years during all this market turmoil.
The 80/50 investment strategy is best suited for the following type of investor:
- Principal protection is top priority.
- Investor has made at least an intermediate-term time commitment (7 to 15 years) to the municipal bond sector.
- Seeking high, well-diversified, tax-efficient income.
- Concerned with market price risk in the “intermediate future”, but not over the short?term.
- Priority of strategy is to maximize yield, while managing reinvestment risk for at least the next 7 to 15 year time-frame.
Background for 80/50:
A value managed intermediate?term investment strategy, the 80/50 is designed to take advantage of the income benefits inherent within the slope of the municipal yield curve, and the defensive structural benefits of premium coupon callable bonds. This combination provides a relatively attractive income strategy, without creating additional risk. More specifically:
- 80% Income: This represents earning 80% of the maximum income available in the municipal market (30-year maturity). For example, if the 30-year municipal bond yield is 4%, then 80% of this is 3.20%. That would be the target yield for the 80/50 portfolio. All bonds with maturities of 15 years or shorter yielding 3.20% or greater would be purchased.
- 50% Risk: This means that the bonds to be bought initially have 50% of the price risk of a 30-year maturing par bond. Price risk is measured by the duration of a bond. Duration represents the change in the dollar price of a bond, given a change in yield. Therefore, the strategy restricts the purchase of bonds to those that have 50% of the duration of the 30-year long-term par bond. A bond with a 5% coupon, final maturity in 15 years, and a 10-year call date priced at 3.20% has an
adjusted duration of roughly 7.8 years versus a bond maturing in 30 years, with a 4% coupon priced at par with a 10-year call has an adjusted duration of roughly 15.5 years.
80/50 Strategy Expectations:
How probable is the execution of the strategy and what are the expected returns? The strategy identifies relative value in the market, which means it does not always exist. Let’s take a look over the last ten years at how probable it was to execute the strategy, and then we can run a simulation return on a portfolio using the 80/50 versus laddering in over time.
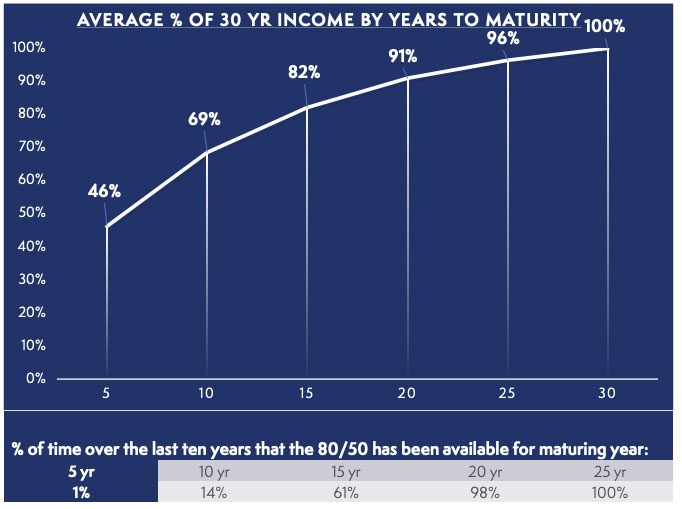
The graph above shows the average percentage of the 30-year yield by maturity over the last 10 years. For example, the 15-year maturity has averaged 82% of the 30-year yield since 12/31/2012.
The chart above shows the percentage of time the maturing year met the 80% target. For example, the 15-year maturity has had a yield that was 80% or higher of the 30-year yield 61% of the time.
How did the 80/50 Perform over the last 10 years?
Background Information:
As a value-based analysis, the 80/50 creates a disciplined approach to when and when not to invest. The easiest way to see if there is value add using the 80/50 filter is to compare it with a “benchmark portfolio” that invests on a scheduled basis. For the analysis below, the following has been assumed:
- Ten years of history (2013-2022), purchases made every quarter for the benchmark portfolio, when that date shows the proper relationship, the bond is also bought by the 80/50 portfolio.
- Only bonds maturing in 15 years, 10 years callable (give or take 6 months, 5% coupons, top tier rated (AAA or AA), and issuers from essential service or General Obligation sectors (minimize sector spread risk) are used for the analysis.
- Due to COVID, no investment was made in the second quarter of 2020 for either strategy.
- The total returns were calculated starting in 2018 (5 years) and each year thereafter until 2022 (10 years). Returns are differentiated by bonds bought before COVID, and then recalculated each year through 2022 with new bonds included after COVID.
- Assume no reinvestment, and bonds are bought on new issue sale date for initial settlement date.
- Total return is calculated by the YieldBook, with prices from Refinitiv.
Analysis Results:
The chart below shows results without including bonds bought after COVID. Why show this? Because when you see the post-COVID results, your first question would be “Looks like COVID really made a mess of things”.
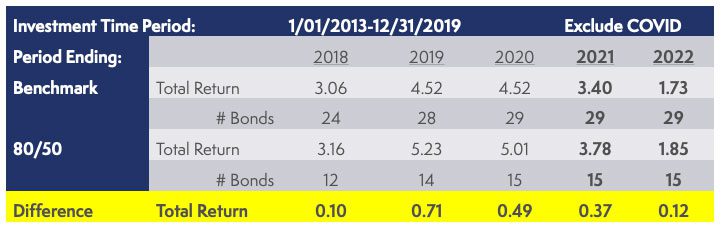
So, from purchases starting in 2013, then calculating total returns over the noted time frame the results look good for the 80/50. The value strategy outperformed in each time period from 71 bps to 10 bps, with an average of 36 bps. The 80/50 filter restricted purchase to roughly 50% of the time so, as of 2020, 29 bonds were bought by the benchmark and 14 for the 80/50. Let’s see what happens if, instead of stopping the purchasing after COVID, we start investing again during the second quarter of 2020 and each quarter thereafter.
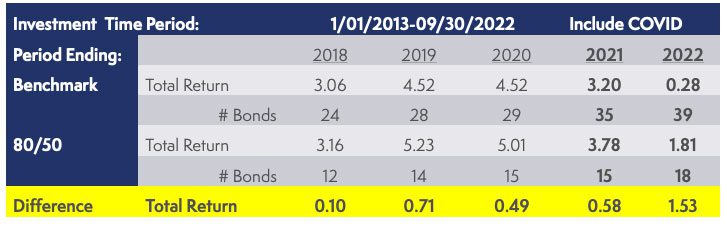
There you go, the 80/50 kept an investor from buying in 2020, and 2021 as the “curve” value was not there. Purchases start again in 2022, such that the benchmark owns 39 bonds, the 80/50 owns 18 bonds. The outperformance including post-COVID activity goes up. Now, it ranges from 10 bps to 153 bps and has an average of 68 bps.
Conclusion:
Let’s go back to the beginning. If I told you there was a game where you could get 80% of the potential payout, while taking only 50% of the risk, would you play that game? I was a bit surprised that there was a consistency to the outperformance, over each time period, but it was also a timeseries where early value stays in the calculation. Either way, over time a disciplined approach to risk versus returns should be a winning one and, in this case, it has been for the last ten years. This analysis remains rather conservative, as it does not include buying higher income issuers, sectors representing value, or credit risk. It is just 5% 15-year AAA/AA rated 10-year callable bonds. No artificial intelligence is needed here, 80/50 is purely organic, gluten free, and yes a SWAN approved investment strategy.