An Update on Muni Defaults:
S&P released their annual Public Finance default analysis for 2023 and MainLine thought this would be a good time to revisit the principal protection power of the “for the public good” sector. It has been four years since our last visit and the impact of COVID on muni credit quality should probably be reviewed. MainLine slices, dices and presents the data, letting you decide if munis remain a SWAN investment.

Munis are kicking in their anticipated seasonal outperformance trend. June was a good start, posting a positive 1.53%, as US Treasuries were down .14%. Longer, lower coupon bonds should benefit the most, as demand will outpace supply in the next 30 to 60 days. What comes next remains the question, as the markets begin to focus on the election.
Muni Market Review
June was the beginning of an anticipated good summer for munis, as they started to outperform. The Bloomberg composite indices showed munis for the month up 1.53%, US Treasuries down -.14%, and US Corporates up .64%. Technicals remain strong for munis over the next 30 to 60 days.
Highlights for the month are as follows:
- Year-to-date, munis are close to even at down -.40%, US Treasuries down -.86% and US Corporates down -.49%.
- Muni curve remains flat to inverted from 5 to 10 years, close to all time curve “rich” levels. The curve steepens quickly from 15 to 30 years, representing historical cheapness. This is reflective of the US Treasury curve, and SMA demand which is focused from 10 years and in.
- Issuance remains strong and still growing, up 37% YTD. Currently, this is being met by high reinvestment cashflows from maturities and coupon payments. MainLine expects issuance to slow in the fall, as we approach the election.
Munis are set up for a good next couple of months, especially bonds 15 years and longer. MainLine is still waiting for munis to richen more by outperforming in the next couple of months and then would look begin liquidation of the Tax Advantaged Opportunity Fund V.
Market News & Credit Update:
- MainLine West is in the process of analyzing the Electric Utility sector of the municipal market and the potential effect climate change could have on their operations and financial strength. The analysis will focus on identifying the risks associated with fire danger, carbon emission, and other factors that could impact their credit quality and debt repayment ability. This study will be used to assess current client holdings to be reviewed in their upcoming semi-annuals and be used as a filter for future purchases.
- US airports are set to issue $21 billion in municipal bonds during upcoming summer months and up to $151 billion by 2027. Proceeds will be used for upgrades and maintenance. This investment can no longer be put off, as travel is setting new highs. Other than basic infrastructure maintenance, airports across the US are also increasing runway capacity and amenities such as retail space and lounges.
- US Courts of appeals determined that bond holders of Puerto Rico Electric Power Authority (PRPEPA) do have a lien on future net revenues for repayment of debt payments owed on current bonds. PREPA, which is in bankruptcy court, tried to argue that the bond holders were only entitled to revenues prior to the bankruptcy. This case ruling is very important for the muni market as to how revenue bonds are secured for investors and the process of Chapter 9. MainLine is not surprised by the verdict, but surprised that PREPA tried to bifurcate its revenues. It was a desperate attempt to fix a long running problem for the service provider.
Municipal Monthly Review June 2024 – Muni Defaults:
Introduction:
The S&P annual study on public finance defaults and rating transition study for 2023 was published in March 2024. This seems to be a good time to once again review what has happened to the credit quality and principal protection of municipal bonds over time. We will dissect the history of municipal defaults, and then do our customary comparisons with US Corporate bonds.
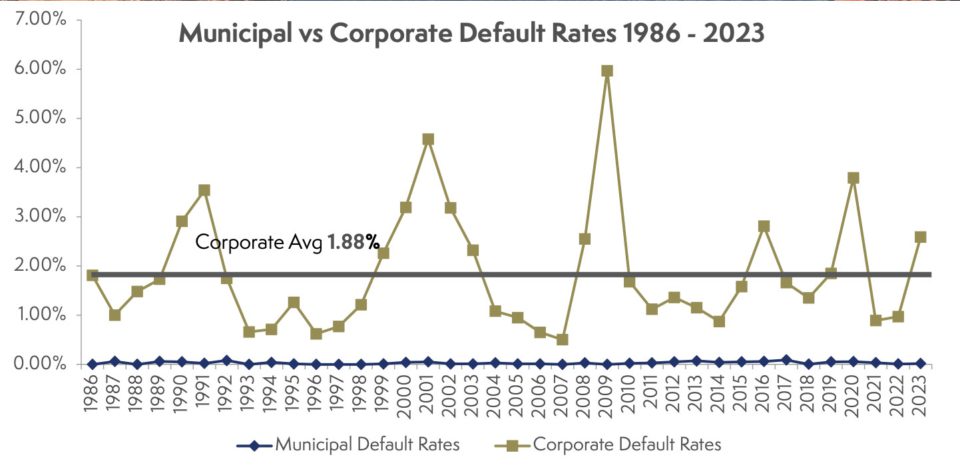
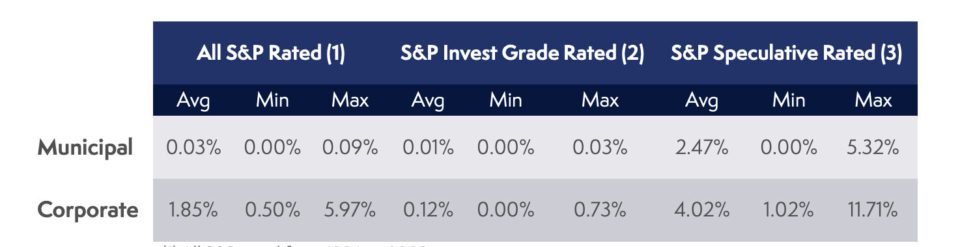
Municipal versus Corporate Default Rates:
MainLine used the annual study published by S&P to analyze the default rate for municipal and corporate bonds as follows:
(2) BBB- rated and higher from 2000 to 2023
(3) Lower than BBB- rated from 2000 to 2023
The chart and graph above show the following:
- Over the last 37 years, on average, the default rate for all rated municipal bonds is .03% versus 1.88% for corporate bonds. Maximum rate for municipal bonds was .09% versus 5.97% for corporates.
- Investment grade comparisons are a bit closer, as municipal average default rate is .01% versus .12% for corporates.
- Once again, speculative comparisons show municipal bonds to be safer at 2.47% default rate versus 4.02% for corporate bonds.
Another way to look at credit quality comparisons is the stability of ratings. This is done by comparing the credit quality migration of ratings over time between municipal and corporate bonds.
The annual migration of credit rating for each are as follows:

(2) US Corporate data is from 1981-2023 from S&P.
(3) Average is not weighted and is arithmetic.
The chart above shows the following:
- On average, AAA-rated munis remain AAA-rated for the year 97.16% of the time versus corporate AA-rated, which remains AAA 87.54% of the time.
- On average, AA-rated munis remain AA-rated for the year 93.97% of the time versus corporate AA rate, which remains AA 87.57% of the time.
- As you move down the credit spectrum, the numbers get more comparative, but, on average, munis migrate 6.2% less in credit rating than corporates.
- Over time, municipal default rates have always been lower than corporate bonds. They have also been less volatile, even during times of credit scares like in 2008, 2010 and recently after COVID in 2020.
- Municipal finance, for numerous fundamental reasons, have lower default rates. Add in the favorable investor treatment of Chapter 9 (for municipal bond holders), versus Chapter 13 (for corporate bondholders), the comparison of principal protection, are not completely fair comparisons. Munis remain the safe principal protector.
Default Analysis for the Municipal Market:
The analysis above could stop with the data presented and most investors would take comfort in principal protection of the municipal market. MainLine decided to take it several steps further and look closer at the sectors and issuers where defaults have occurred, to make the average default rate of .03% even lower.
Below is a graph showing the number of defaults per year from all rated, investment grade and speculative rated:
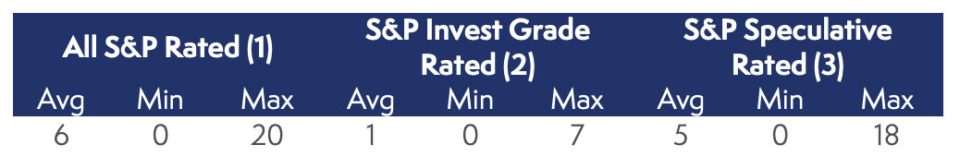
(2) BBB- rated and higher from 1986 to 2023
(3) Lower than BBB- rated from 1986 to 2023
Municipal Defaults
The chart shows, on average, there are six issuers who default per year, five from speculative grade (high yield), one from investment grade. The maximum was eighteen in 2017 and the minimum was zero in 1997.
In 37 years, there have been 230 issuers defaulted. Of these, 194 (84%) were speculative (below BBB- rated) and 35 (16%) were investment grade rated (BBB- and greater). On the following page is a chart showing the defaults by sector and rating:
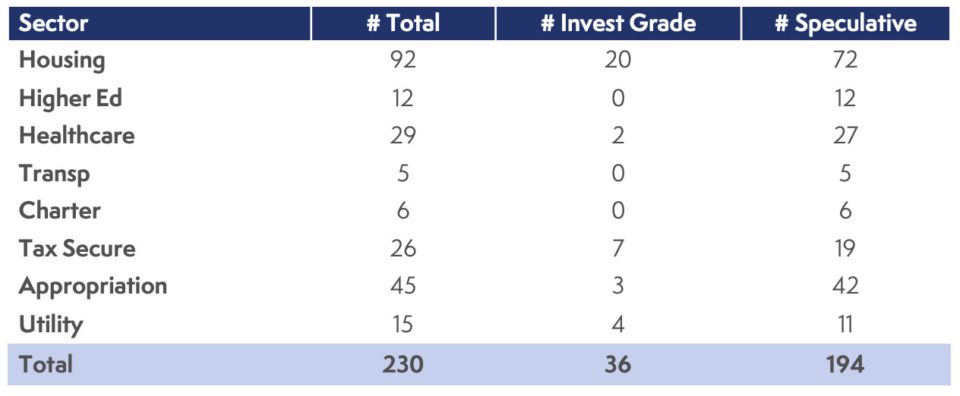
- 92 were from the housing sector (with only 20-investment grade). 7 of these 20 were in 2020 and were rated senior living facilities. Most of the defaults have come from senior living and student housing issuers. MainLine is an investor in state/city single family and multi-family issuers. There have had been no defaults in these issuers.
- 45 were from appropriated bonds. These projects are considered “moral obligations” to be repaid by the issuers and requires an annual appropriation for debt service payment. Of these 45, 23 were tied to the Detroit and Puerto Rico bankruptcies, and more specifically 42 had speculative ratings.
- 29 were from healthcare issuers, but only 2 were investment grade in credit quality.
- 26 were backed by current or future tax revenues. Of this 26, 19 were related to the Detroit and Puerto Rico bankruptcy and most of the others are tied to anticipated tax revenue growth for the development of a project.
Conclusion:

What does this all tell us? S&P rates 23,594 issuers. Of this total, .03% will default, meaning 1 in 3,400. If an investor only purchases investment grade issuers (BBB- and above), the default rate is .01%, or 1 in 10,250 issuers. Lastly, if the investor wants to filter the risk out further, eliminate student and senior housing you get 16 defaults over 37 years, which averages out to .002% chance ( 1 in 50,000).
Keep sleeping well at night!