Hello SOFR, Goodbye LIBOR
That’s a wrap. As of June 30, 2023, LIBOR is dead and gone forever and SOFR has become the index of choice for hedging interest rate risk. Over 90% of swap activity in June was with SOFR-based hedging, showing its acceptance by the investing world. As of early 2023, MainLine fully converted the Family of Funds’ LIBOR swaps to SOFR. This month, we review how SOFR is doing in its new firstteam role and what it means to the Family of Funds.
It’s halftime in the muni market for 2023. It seems like a scoreless first half, with a lot of good and bad plays, yet the market is close to unchanged. Bloomberg Composite indices total returns year-todate shows: Munis 2.68%, US Treasuries 1.33%, and Corporates 2.67%; it looks like a defensive-minded “clip the coupon” game plan. Is it time to open up the playbook for the second half of 2023? MainLine has a few thoughts…

Muni Market Review
Munis are going in for halftime after six months of lethargic, unfocused performance. Is it time to change the game plan? There has been a lot of market and economic noise over the first six months and some attempts at some big plays, but not much to show for it. Year-to-date yields are only +2 to -9 bps changed versus taxable at +19 to -1 bps. Other halftime highlights:
- Supply is lower by 20% from 2022, 10% lower from the last 5-year average. There appears to be little motivation to borrow and build new projects (new money -22%, refunding -16%). Confidence lacking?
- Secondary bid wanted activity is only 82% of 2022’s daily par amount. This includes the $7 billion being liquidated by SVB. Is there no desire to trade out of bonds?
- Credit quality is strong: Default trends from MMA shows only 1 chapter 9 filing year-to-date (average 6.5 a year, total of 2 in 2022) and upgrades according to S&P continue to outpace downgrades 3 to 1. Looks like some potential?
Is it time for any halftime adjustments? Can the muni market sustain the same lethargic performance given all of the noise around it? MainLine feels munis are setting the competition up for solid second half. The quiet first half should be giving investors some confidence, technicals still look bullish, and munis have proved themselves through the years to be a solid second half performer (late cycle outperformance). Some plays that could help open things up are buying 4% coupons, stretching out on the yield curve, housing and hospital sector bonds, and looking at shorter-call bonds.
Market News & Credit Update:
Build America Mutual (BAM), stopped by MainLine West’s offices a few weeks ago to catch up on the monoline muni insurance industry and their operations. In 2022 7.5% of issuance came insured, making it still just a minor player in the muni market after its collapse in 2010 and the days when 50% of new issuance sported some form of additional principal and interest protection. BAM continues to grow its market share as its” mutual ownership” structure is perceived to be safer by investors and carries AA S&P rating. MainLine respects BAM’s role in the muni market but remains undedicated to buying bonds based on the BAM assurance to repay if something goes wrong with the issuer. Muni defaults are so low to begin with, with our expertise, it seems like a waste of our investors’ money to pay for additional “protection”.
A recent analysis on the effect of higher rates on callable bonds by Bank of America municipal
research group was quite interesting. They found that bonds issued with a 10-year call date on
average prior to 2022 were called within 55 days of eligibility and since 2022, it has been only 27
days. Why? The low rates in 2020, and 2021 resulted in significant cost saving from calls, and many
of bonds became eligible that were not initially. Since the rate rise in 2022, fewer bonds are eligible and, therefore, those that are refinanced quickly.
Hello SOFR, Goodbye LIBOR:
Introduction:
MainLine reviewed the pending transition of LIBOR to SOFR in our 2022 March monthly review, as of the end of June 2023, the conversion is complete. MainLine will take this moment to review why this happened, and what it means to our Family of Funds.
Background:
The LIBOR scandal during the banking crisis brought about the demise of LIBOR-indexed products. LIBOR was a fictitious index rate set by Wall Street banks that was used to buy and sell investment products. During the crisis and the implosion of bank balance sheets, banks set the LIBOR rates to benefit their needs. This was not a big deal on a price comparison basis, but when you slant a multi trillion-dollar market by a few basis points, you can make a lot of money.
In 2017, regulators announced the phasing out of LIBOR and, in return, demanded a market-based index that reflected an actual market with actual trades, and not fictitious ones. The invention of the regulators was SOFR (Secured Overnight Financing Rate) which is based on the overnight risk-free lending that is published daily. It is a broad measure of the cost to borrow cash overnight on loans that are collateralized by Treasury securities. In other words, this is also called the US Treasury REPO market. The rate is calculated from actual market transactions in what is roughly $700 billion a day traded market. The current transition from LIBOR swaps was initially indexed to only overnight investments but has now been extrapolated out the curve for term rates. For example, a ten-year swap rate was created by bootstrapping overnight repo rates ten years out the curve.
SOFR is Here:
As the transition is now live and the Family of Funds are fully converted, MainLine has done a detailed analysis comparing LIBOR with SOFR indexed swaps that dates back to 2011. There is only actual historical trading SOFR data from May 2019, so there needed to be a recreation of SOFR data to do our historical analysis. Mainline reviewed how this information was created and then isolated the following:
- Relationship of changes in LIBOR and SOFR with US Treasuries
- Compare volatility of rate changes in LIBOR and SOFR indices
- Compare the relationship of the muni yield ratios for LIBOR and SOFR based calculations
- Impact of the conversion to SOFR versus LIBOR for the Family of Funds
- Isolate these relationships for the full time period of 2011-June 2023, and isolate the pre SOFR
trading 2011-2019 (include 2019 in this time period as the index was not very active and
conversions to SOFR were not occurring) and then 2020 to June 2023, the timer period for the
“active” SOFR market
SOFR Recreated:
On January 31, 2023, Bloomberg created a historical database back to 2007 for the SOFR yield curve (overnight to 30 years) that was used in our analysis. Bloomberg created SOFR rates from January 2007 to May 2019 by doing the following:
- Used the Fed Funds index as the independent variable as it was the closest index to what SOFR represented
- Analyze the average spread relationship between SOFR and Fed Fund from May 2019 to present
- Used this spread to recreate SOFR off of the Fed Funds curve back in time
- Historical SOFR data was recreated without the use of LIBOR, making its relationship independent of LIBOR, which MainLine approves of
- MainLine limited its historical analysis to 2011, as muni yields being used are much cleaner in our database from that date to the current
LIBOR versus SOFR Relationship:
1) US Treasuries versus SOFR & LIBOR:
A good first look at SOFR versus LIBOR rates is to see how they move with changes in US Treasury rates. US Treasuries are considered the base line comparisons for fixed income assets. Yes, even munis over time adjust to US Treasury levels and movements. The easiest and most impactful analysis is to do regression analysis using the 10-year US Treasury rates as the independent variable and compare its changes to the dependent variables of 10-year SOFR and 10-year LIBOR rates. A perfect relationship between the two would be an R-squared of 100%. Below are the R-squares MainLine calculated between the two hedging indices over the various time periods we discussed above.
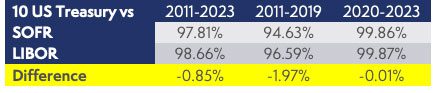
Chart shows the following:
A very strong correlation for both indices with US Treasuries.
A bit stronger for LIBOR for the entire time period. 2020-2023, the active trading period for SOFR shows the best and highest correlation, right on with LIBOR and almost perfect with US Treasuries.
2) Volatility of SOFR vs LIBOR
As we see above the two indices move in a tight correlation with US Treasuries, which is what MainLine wants. Yet, how volatile do they move around US Treasuries day to day? Below is a chart showing the volatility of each hedging index over the various time periods:
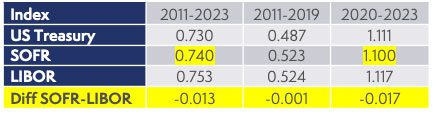
The chart shows the following:
- SOFR may have little lower daily changes in rates than LIBOR at .74 versus .753. It moves up and down less and remains tightly correlated with US Treasuries.
- Standard deviation of daily rate changes is not volatile enough to create any real difference day to day with hedging in SOFR versus LIBOR.
Muni Yield Ratio: SOFR vs LIBOR
How well does SOFR change with muni yields versus LIBOR, i.e. how does it work as a muni hedge? The graph and chart below use the Bloomberg indices from 01/01/2011 to 6/01/2023 for the 15 year muni as a ratio versus the 10 year rates for both indices
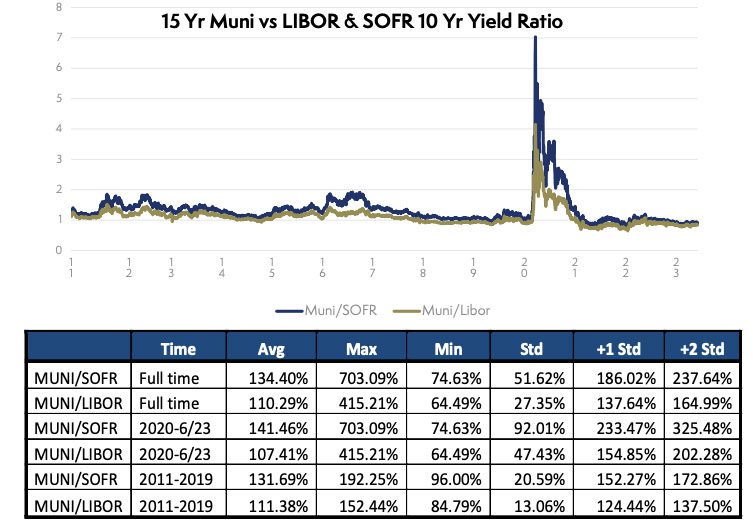
What does this graph and chart show?
- On average, Muni/SOFR yield ratios are 20 to 30 bps higher as SOFR is the “risk-free” rate, versus LIBOR which reflects bank risk.
- From 2020 to current, the ratio is wider close to 35 bps, the historical comparison (2011- 2019) is closer to 20 bps different.
- Standard deviation (change from the average) is higher for SOFR, making it appear more volatile. This can be traced back to the differences in the ratio and the higher values for SOFR due to “risk free”.
- This is the same with the max and minimum ratio comparison, SOFR is higher.
Hedging is about protecting an investment against changes in value and not the initial value, as all swaps start with a zero value. The information above shows a different level, due to the difference in the credit quality of SOFR versus LIBOR, but the changes from there are tightly correlated, making SOFR just as good as LIBOR as a hedge.
4) SOFR and the Family of MainLine Funds:
- SOFR rates are tightly correlated to changes in US Treasuries, just as LIBOR was. SOFR swaps provide a highly correlated hedge for changes in US Treasury rates, which LIBOR used to do.
- SOFR swaps will have the same relationship with the changes in muni rates, just that the ratios will be higher.
Other Impacts:
- LIBOR at times can trade much cheaper as it is based on bank lending rates. When there appears to be a weakening bank credit environment, LIBOR could spread out more versus SOFR. This, if timed with muni value, could add extra performance to the Funds. That being said, if the opposite happens and LIBOR is tight when the fund is executed, the widening of LIBOR going forward could subtract from the performance of the Fund.
- The floating rate on SOFR swaps resets daily, while LIBOR was a 3-month index that was reset weekly. The timing of the SOFR daily rate is better correlated to the 7-day SIFMA muni rate that the Funds pay. This means the receiving rate of the SOFR swaps will change quicker and more in sync with the funding rates for the Funds.
CONCLUSION
SOFR provides the Funds with the hedge they need to offset changes in interest rates, and the opportunity needed to add relative value to the Funds’ arbitrage strategy.