The Muni Fear Index
The muni market can make a half-awake nightmare become a live reality. It would be an understatement to call this principal-first, stable fixed income sector merely skittish and easily rattled. What is the monster that munis are afraid of? Tax cuts? Losing tax exemption status? DC cutting state aid? These are all minor concerns day-to-day in muniland, but the big boogie monster is volatility. This month, MainLine takes a look at the impact of price movements on muni performance to determine whether investors need to be scared of the “Muni Fear Index”.

The muni market continues to defy gravity –oris it the other way around? Muni performance for the month was -.01% vs US Treasuries -1.76%, and US Corporates -1.71%. Going forward, MainLine feels muni technicals will stay solid, as increased supply is met with increased demand and volatility remains on the downtrend – providing comfort for a smooth 2024 muni ride.
Muni Market Review
The muni market defied gravity -or- is it the other way around? Yields barely moved, as taxable yields moved up strong, with the market adjusting to Fed rate cuts later in 2024 than originally expected. Muni technicals stay solid as increased supply is being met with increased demand and volatility remains on the downtrend, providing comfort for skittish muni investors. February highlights were as follows:
- Muni yields were higher by 8 to 7 bps, with taxables higher by 50 to 24 bps.
- Year to date issuance is up 23% from 2023 ($9 billion) and is being met by mutual fund inflows (up $6.9 billion) as investors are finally returning to fixed income and munis after leaving in 2022 & 2023.
- Muni yield ratios remain rich. However, the important takeaway is their tax-equivalent amid less concern (volatility) that a rate rise is imminent.
There could be a drag over the next 30 to 60 days on muni performance, as they have done quite well to date in 2024. There should not be a “correction”, just slight underperformance – setting up for a strong summer market.
Market News & Credit Update:
- Interval Funds are becoming a new and popular product in muni mutual closed-end funds. Since PIMCO launched the first one in 2019, assets have grown from $63.5 billion in 2022 to 79.2 billion in 2023. The structure allows an investor to periodically to sell a portion of their shares back at the NAV, which could be monthly, semiannually, or annually. They set “gates” (restrict liquidity) by limiting when you can take money out and how much you can withdraw. This allows the Fund to buy less liquid issuers and pick up income. For an investor with flexibility, risk appetite, and deeper pockets, these Funds make sense giving up liquidity for income versus a traditional fund. It still can’t beat your own separately managed account at MainLine.
- The Trump tax cut of 2017 is set to expire in 2025 and the top tax bracket will return to 39.6% from the current 37%. This will add some value to munis. Assuming a max yield of 4% at the moment, the increase in the top tax bracket will increase the tax equivalent calculation (also include the 3.80% Medicare tax) from 6.76% to 7.07%. That is over 30 bps more tax savings, or for $1 million par, $3,500 in annual income. The power of the tax-equivalent calculation. It’s all in the math!
- It’s news like this that makes me proud to be in the muni business. Last month Telluride became the first ski town to sell tax-exempt bonds back by the city with some of the proceeds being used to build affordable housing for its teachers. The cost of housing is much higher than the salaries that the teachers are paid. To keep staff and schools open, the need for housing has become necessary. There will be more ski towns to follow and likely other “resort” towns across the country. How does that look as muni finance for the public good? Nice job Telluride! FYI.. MainLine was involved and bought some bonds for its Colorado based clients.
The Muni Fear Index:

Introduction:
In our 2024 Outlook, we discussed markets would be calmer and this would lead to munis doing well, as they settle into a Ferris Wheel ride for 2024 versus the rollercoaster they have been on for the last three years. A good way to measure market calmness is to follow the volatility of the markets and then see how muni investors have reacted historically.
Muni investors over time have shown they do not like uncertainty, the unknown, and can make a halfawake nightmare become live reality. Is the volatility index that can be used to measure muni investors’ concerns? Or in other words, is there a “muni fear index”.
In this month’s monthly review, we will discuss volatility and how it relates to munis –and- if investors should fear it
Background:
Market volatility- The frequency and magnitude of price movement up or down. The bigger and more frequent the price swings, the more volatile the market is.
MainLine’s Hypothesis: What does high volatility do to a muni investor? It makes them afraid to buy bonds for fear they may lose money. What does a low volatility, calm muni market do to a muni investor? It allows retail investors to pick and choose bonds without concern that prices are changing tomorrow and possibly going down in price. MainLine feels most munis investors do not see volatility as an opportunity, they only see the risk of loss. As conservative, principal protection priority investors, losses are hard to accept. Even if they are planning to hold until maturity and get par back from the investment. They only see the worst potential short-term outcomes from an unstable situation. Therefore, making a potential “nightmare scenario” a reality in their mind and the basis for their investment decisions.
MainLine will look at two different types of volatility measurements for our analysis to see how munis performed versus the US Treasury “risk-free” investment. Munis should outperform US Treasuries, if “vol” is a fear index, in periods of low vol and/or in periods of declining vol. On the other hand, munis should underperform when vol goes up, signifying more fear. MainLine’s analysis involves: the following vol indices to be used as the “fear indicator”:
- Muni 30-day average AAA-rated 30-year yield volatility – This is a continuous 30-day average of the standard deviation of yields for the 30-year muni index. For example, 20% vol means 20 bps is the one standard deviation movement in rates over the last 30 days. For example, if the current yield is 3.50%, the range over the last 30 days was 3.30% to 3.70%. MainLine used the 30-day average and then created a 30-day average of the 30-day average (effectively a 60-day average) to also be used in this analysis.
- VIX – Chicago Board Options Exchange Volatility Index– is the measure of expected stock price volatility measured as a percent of expected difference in S&P growth rate over the next twelve months. For example, a 20% VIX means investors feel there is risk the S&P goes up or down 20% in price in the next year. So, if the S&P is at 5,000, the market perceives it could go up to 6,000 or down to 4,000. To match the muni volatility calculation and even out daily movement, MainLine created a 30-day average and a daily average to be used for this analysis.
Data Analysis:
Below is a chart showing 30-day average 30-year muni yield volatility versus daily VIX index by year from 2019 to year-to-date 2024, and their averages for the entire timeframe:
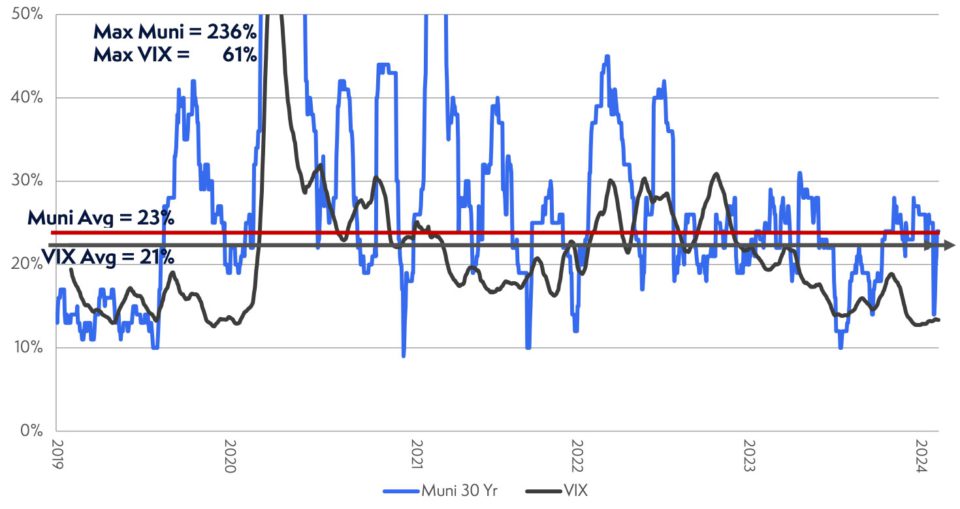
The indices move a bit alike, with munis looking like its more “volatile”, higher ups, lower downs. This is not what it appears to be. The Muni volatility and VIX are not comparable on the surface. By looking at the numbers and not understanding them, you would think munis were more volatile than stocks. Remember, in our definitions above, muni volatility is in basis point and a 30-day measure, VIX is in price (or dollars) and an annualize measure. The muni volatility needs to be converted from yield to price change, (dollars), and the VIX needs to be converted to a 30-day average. So how does muni volatility look after we make these adjustments?
- Assume a 23% muni 30-year vol, 10 years callable, 4% yield, therefore a change to 4.23% which causes a change in price using a DV01 (dollar value of a bps move on a 30 year 10 year callable bond) of .08607 gives us a 1.98% change in dollar price
- VIX of 21% (which is an annual measure) needs to be converted to monthly implied vol (divide by the square root of 12). This gives us a 6.06% change in the dollar price.
- Therefore, stocks are actually three times more volatile than munis at 6.06% versus 1.98%.
MainLine then ran a series of total return calculations to see how munis performed in high and low vol markets versus US Treasuries, using the muni vol index and the VIX index (four total analysis’). We isolated time periods in two different ways.
- Vol directional trend analysis– time-period was when the index peaked either high or low, and then moved back in the other direction to get to back at or close to a “high” or “low” level versus the average.
- Stable vol time analysis – time-period where the index was at a “low” or “high” level versus the average for an extended period of time. Not moving outside the low or high-range showing a consistent vol market.
Fear Index Analysis Results:
The total return results are presented as a “go long munis” in times of lower vol, and then go long US Treasuries in times of higher volatility. We compare these results with the buy and hold for munis and US treasuries during the same time-period of 01/01/2019- 02/08/2024. Hypothetically, if these indicators do represent fear and they influence the performance of munis versus US Treasuries, the strategy being tested should outperform the buy and hold munis and US Treasuries.
The chart below combines both indices using both time-period measures and both weighted average and daily index measures for filtering the time periods. It also shows the difference between the strategies and the muni benchmark return over the entire time-period.
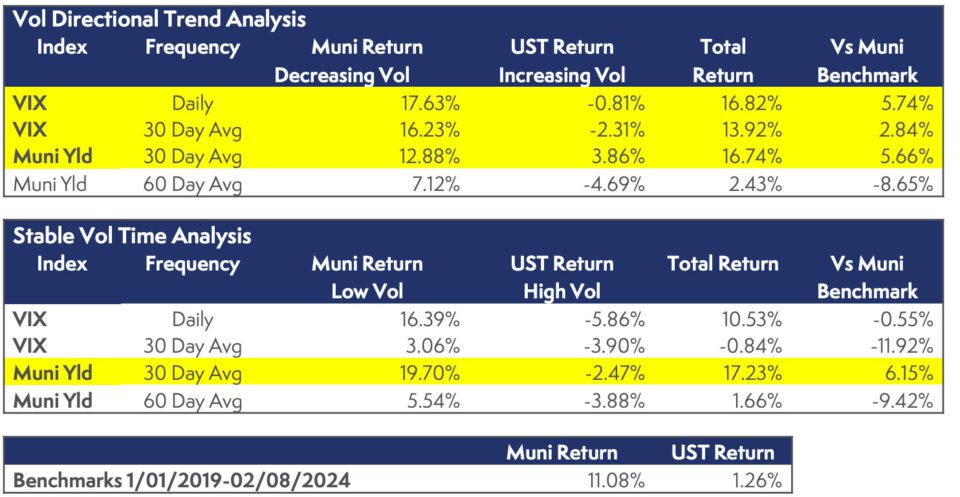
Results are favorable in four of the eight results analyzed (highlighted in yellow). More specifically:
- VIX daily and 30-day average, when filtered by vol directional trend analysis outperformed. Daily earned 5.74% higher, 30-day earned 2.84% higher.
- Muni yield vol for 30-day average for both the directional trend analysis and stable time analysis outperformed. Trend outperformed by 5.66%, stable by 6.15%
- VIX stable vol was a horrible indicator, along with the 60-day muni average, which is just too long.
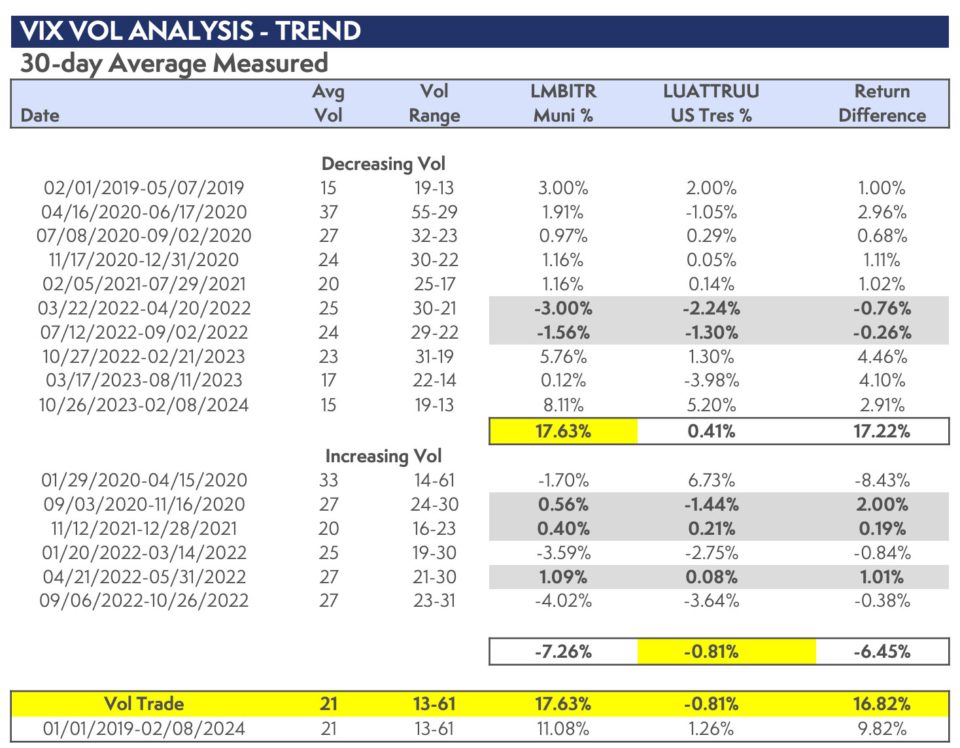
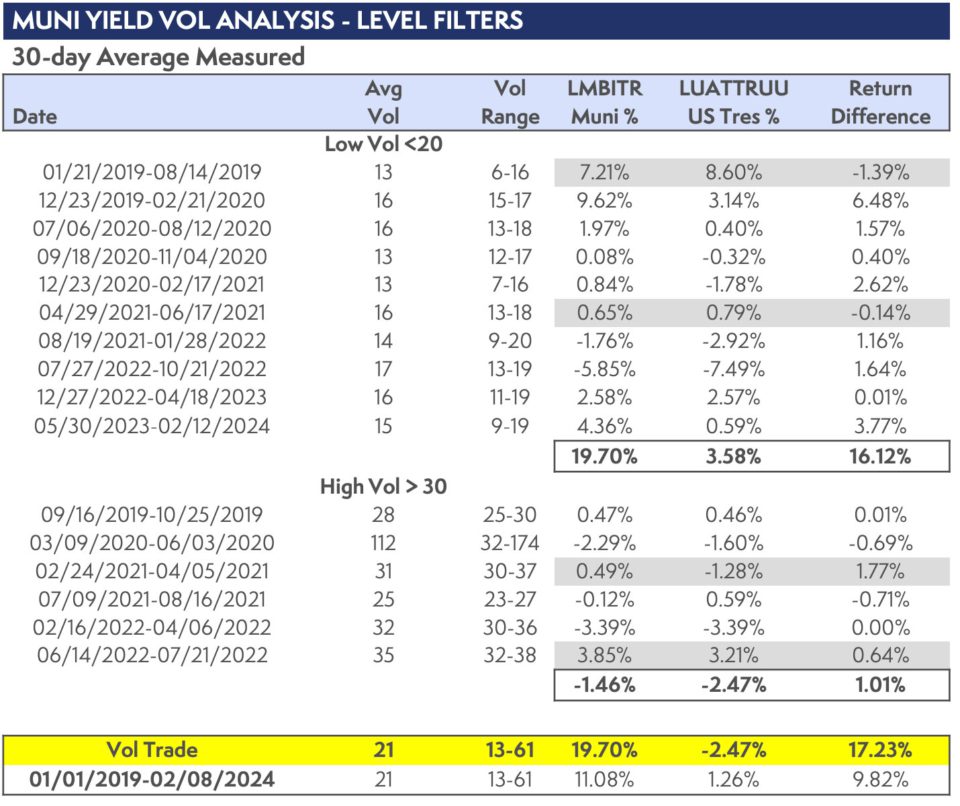
Below, we present the detailed time series analysis for the top two performers above. Highlighted in orange are the underperformance time periods. VIX 30-day average directional trend first, 30-day muni yield average stable trend analysis were as follows
Full Disclosure, and Transparency:
- The results of this study are a broad stroke and would not get certified by any board of analysts. The time periods isolated for return calculations were chosen by simple filters of volatility changes and trends. To make this more valid, one would want to set up rules for buy and sell decisions and not “eyeball” it.
- The indices used for total return calculations were Bloomberg composites for munis and US Treasuries. They consist of the entire maturity curve as represented by the underlying market and returns are not adjusted for taxes. So, munis are understated, and changes in the slope of the yield curve will impact each index differently.
- There are many other factors that go into muni returns that are not part of this analysis. For example:
- There was no adjustment made to the investment strategy regarding the relative value of
munis and if they are rich/cheap as the trade begins or ends. - Credit quality news and up and downgrade trends.
- Supply/demand technicals,
- DC tax politics and state stimulus programs
- There was no adjustment made to the investment strategy regarding the relative value of
- The COVID trade (April 2020 to June 2020) which signaled move out of munis into US Treasuries, depending on when executed and for how long impacts the outperformance by various amounts, especially for the VIX detailed chart,
- No fees or bid offer spreads were included in this analysis, which would adversely impact the strategies’ returns.
Conclusion:
After all these numbers and different looks, can we say munis have a fear index? MainLine thinks understanding the mentality of muni investors and some of the positive results listed above, the answer is “Yes”.
VIX tracked by daily changes and focusing on decisive directional changes, along with tracking the 30-day average vol of 30-year AAA rate munis during times of stable levels above or below the average gives us a measure of “fear” for munis.
MainLine has added this to its list of things to monitor going forward. It would be interesting to run the analysis over a longer time frame and use all three outperforming results as filters.
As of early 2024, volatilities in the macro market and munis have been in a systemic decline, implying reduced probability of economic or market shocks in a soft-landing environment. A low volatility environment should provide a favorable backdrop for picking and choosing munis for investors and any spike in muni rates should be contained. Low volatility should allow muni investors to enjoy that Ferris wheel ride in 2024 without any fear!
A Final Word on Muni Vol:
The MainLine West Family of Funds are not afraid of the “Fear Index”, as they view volatility as an opportunity. The trade highlighted in this study is a fundamental strategy for the MainLine West Family of Funds: go long munis when they are cheap (which at times can be due to an increase in volatility) and terminate a Fund when munis are rich, (which at times can be when volatility is low). The Funds have an extended life versus the above trading strategy to also pick up the arbitrage opportunities that the muni curve versus taxable presents itself which is the 5-to-7-year time frame. The Funds are also focused on providing high after-tax income, which is not a factor in this vol analysis.

View the Monthly Review PDF here – View February Report Charts